Calculators
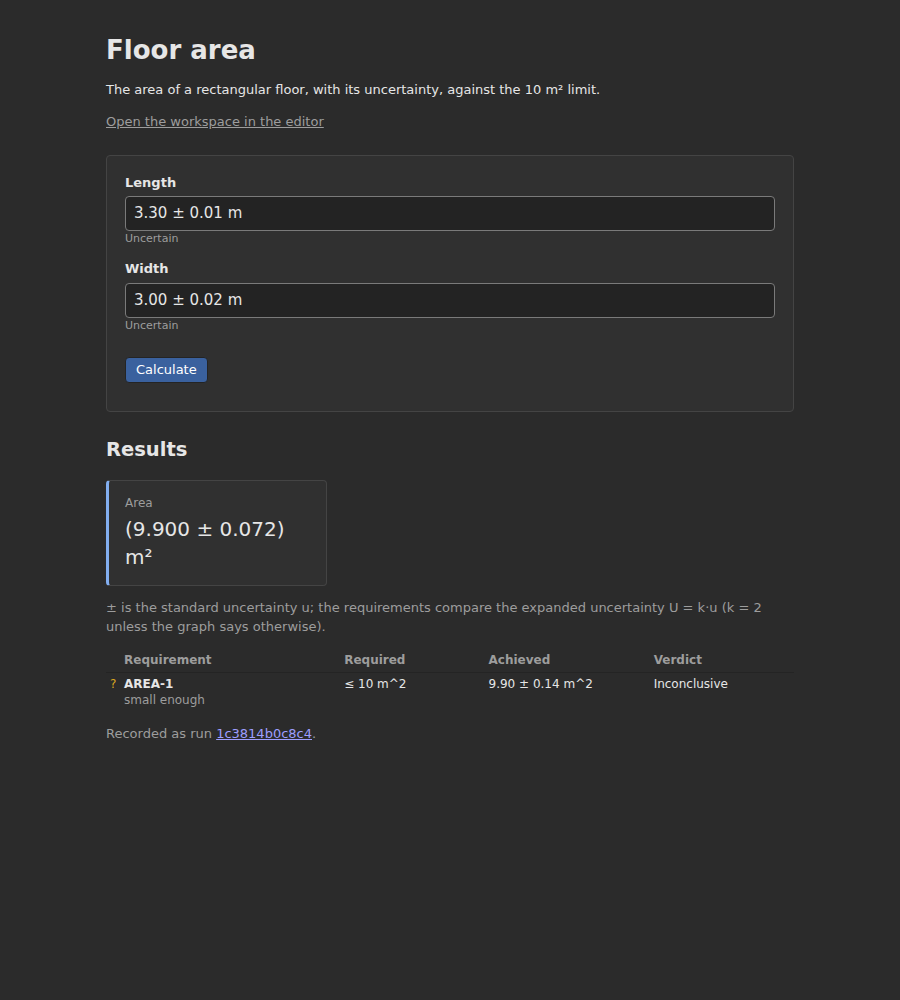
A calculator turns a saved graph into a simple form for people who never open the editor: a colleague checking a design, a client, a technician on site. They fill in the inputs you chose, press Calculate, and get the results with their uncertainty and the verdicts of the graph’s requirements. Nothing else in the graph can change.
The tutorial’s chapter Share it as a calculator sets one up step by step (Help › Tutorial).
Setting one up
Track the results. A calculator shows tracked outputs: right-click each output socket you want people to see and choose Add to Tracked.
Open Share › Calculator… (also in the command palette, Ctrl+K). It needs the right to edit the graph.
Title and Description: what the people using it read first.
Inputs: tick the settings that become the form’s fields, and give each a plain label (“Length”, not “Quantity › Value”). Every setting with a widget that is not linked is offered.
Results: tick the tracked outputs to show, and label them.
Show the verdicts of the graph’s requirements: on by default.
Save.
Save the graph (Ctrl+S). The calculator runs the graph as it is saved: later changes reach it when you save them.
Share › Calculator… then offers Open the calculator ↗: the form at
/calc?ws=<workspace>&graph=<graph>, which anyone who may run graphs in the
workspace can open.
Using it
The form shows each input with the value the graph was saved with, as a text
field, a number, a dropdown or a checkbox, like its widget in the editor. A
quantity is typed with its unit and, if it has one, its uncertainty:
3.30 ± 0.01 m.
Calculate runs the graph with only those inputs changed. Values the graph cannot take, such as text where a length goes, are reported before anything runs. The results show each value with its standard uncertainty, and the requirements table shows each verdict: met, not met or inconclusive, against the expanded uncertainty U = k·u (see Requirements and conformity).
Every calculation is an ordinary run: it waits its turn in the run queue, runs in a process of its own, writes a provenance record, and adds a line to the graph’s tracked history, so the Tracked and Requirements tabs show what was calculated, by whom and when.
Limits
Inputs are settings of nodes on the Processing or Reporting canvas; settings of nodes inside a subgraph cannot be listed.
Results are tracked outputs: a value that cannot be tracked (an array, a table, a figure) shows its summary only.
The calculator runs the saved graph, so unsaved changes on screen are not in it.
For scripts and agents
A calculator is kept in the graph document’s metadata, so a graph written as JSON or by an agent can carry one:
"metadata": {
  "calculator": {
    "title": "Floor area",
    "description": "The area of a rectangular floor against the 10 m² limit",
    "inputs": [
      {"node": "L", "input": "value", "label": "Length"},
      {"node": "W", "input": "value", "label": "Width"}
    ],
    "outputs": [{"node": "A", "output": "result", "label": "Area"}],
    "requirements": true
  }
}
Its outputs are written like tracked outputs (node, output, optionally a
path into a field). The server’s routes are:
Route |
What it does |
|---|---|
|
The form: title, description, each input’s key ( |
|
Runs it; returns the status, each result ( |
See noodlelab.core.calculator in Core concepts.